
Vega-Lite templates for Deneb
This page contains some vega-lite templates you can use for Deneb in Power BI. I do not post them in GitHub because I hate GitHub and it is too far down my list of things I have time to learn. If you have the burning desire to post them on a Deneb GitHub repo, feel free to do so, but please credit me.
I will most likely create a video as to how you can use these templates. When it is done, you will find the link here.
{
  "$schema": "https://vega.github.io/schema/vega-lite/v5.json",
  "usermeta": {
    "deneb": {
      "build": "1.4.0.0",
      "metaVersion": 1,
      "provider": "vegaLite",
      "providerVersion": "5.4.0"
    },
    "interactivity": {
      "tooltip": true,
      "contextMenu": true,
      "selection": true,
      "highlight": true,
      "dataPointLimit": 50
    },
    "information": {
      "name": "Dynamic Details",
      "description": "[No Description Provided]",
      "author": "Ben Ferry",
      "uuid": "cf7d0613-a9cc-4990-b815-e6dba6dcf504",
      "generated": "2022-10-28T11:23:47.221Z"
    },
    "dataset": [
      {
        "key": "__0__",
        "name": "round",
        "description": "",
        "type": "numeric",
        "kind": "column"
      },
      {
        "key": "__1__",
        "name": "RoundCounts",
        "description": "",
        "type": "numeric",
        "kind": "measure"
      },
      {
        "key": "__2__",
        "name": "Total pts by GW",
        "description": "",
        "type": "numeric",
        "kind": "measure"
      },
      {
        "key": "__3__",
        "name": "SelTeam",
        "description": "",
        "type": "text",
        "kind": "measure"
      }
    ]
  },
  "config": {
    "view": {"stroke": "transparent"},
    "font": "Lato",
    "arc": {},
    "area": {},
    "bar": {},
    "line": {
      "strokeCap": "round",
      "strokeJoin": "round"
    },
    "path": {},
    "point": {
      "filled": true,
      "size": 75
    },
    "rect": {},
    "shape": {},
    "symbol": {
      "strokeWidth": 1.5,
      "size": 50
    },
    "text": {
      "font": "Lato",
      "fontSize": 11
    },
    "axis": {
      "ticks": false,
      "grid": false,
      "domain": false,
      "labelFontSize": 11,
      "titleFont": "wf_standard-font, helvetica, arial, sans-serif",
      "titleFontSize": 12,
      "titleFontWeight": "normal"
    },
    "axisQuantitative": {
      "tickCount": 3,
      "grid": true,
      "gridDash": [1, 5],
      "labelFlush": false
    },
    "axisX": {
      "labelPadding": 10,
      "labelAngle": 0,
      "zero": false
    },
    "axisY": {"labelPadding": 15},
    "header": {
      "titleFont": "wf_standard-font, helvetica, arial, sans-serif",
      "titleFontSize": 12,
      "labelFont": "Lato",
      "labelFontSize": 10
    },
    "legend": {
      "titleFont": "Lato",
      "titleFontWeight": "bold",
      "labelFont": "Lato",
      "labelFontSize": 13.333333333333332,
      "symbolType": "circle",
      "symbolSize": 75
    }
  },
  "data": {"name": "dataset"},
  "layer": [
    {
      "mark": {
        "type": "area",
        "strokeWidth": 4,
        "line": {"color": "#7b516f"},
        "color": {
          "x1": 1,
          "y1": 1,
          "gradient": "linear",
          "stops": [
            {
              "offset": 0,
              "color": "white"
            },
            {
              "offset": 1,
              "color": "#7b516f"
            }
          ]
        }
      }
    },
    {
      "transform": [
        {
          "window": [
            {"op": "rank", "as": "rank"}
          ],
          "sort": [
            {
              "field": "__2__",
              "order": "descending"
            }
          ]
        },
        {"filter": "datum.rank <=1"}
      ],
      "mark": {
        "type": "text",
        "yOffset": -120,
        "size": 60,
        "fontWeight": 800
      },
      "encoding": {
        "text": {"field": "__2__"}
      }
    },
    {
      "transform": [
        {
          "window": [
            {"op": "rank", "as": "rank"}
          ],
          "sort": [
            {
              "field": "__2__",
              "order": "descending"
            }
          ]
        },
        {"filter": "datum.rank <=1"},
        {
          "calculate": "'points scored by- '+ datum['__3__'] +' made round '  + datum['__0__'] + '- the most highscoring round.'",
          "as": "NewText"
        }
      ],
      "mark": {
        "type": "text",
        "yOffset": -80,
        "size": 20,
        "lineBreak": "-"
      },
      "encoding": {
        "text": {"field": "NewText"}
      }
    },
    {
      "mark": {
        "type": "text",
        "yOffset": -10,
        "size": 12
      },
      "encoding": {
        "text": {"field": "__2__"}
      }
    }
  ],
  "encoding": {
    "x": {
      "field": "__0__",
      "type": "ordinal",
      "axis": {"labelPadding": 0},
      "title": null
    },
    "y": {
      "field": "__2__",
      "type": "quantitative",
      "axis": null
    }
  }
}
{

  "data": {"name": "dataset"},
  "layer": [
    {
      "mark": {
        "type": "area",
        "line": {"color": "#7b516f"},
        "color": {
          "x1": 1,
          "y1": 1,
          "gradient": "linear",
          "stops": [
            {
              "offset": 0,
              "color": "white"
            },
            {
              "offset": 0.8,
              "color": "#7b516f"
            }
          ]
        }
      }
    },
    {
      "mark": {
        "type": "bar",
        "width": 2,
        "clip": true,
        "color": {
          "x1": 1,
          "y1": 1,
          "gradient": "linear",
          "stops": [
            {
              "offset": 0,
              "color": "white"
            },
            {
              "offset": 0.8,
              "color": "#7b516f"
            }
          ]
        }
      },
      "encoding": {
        "opacity": {
          "condition": {
            "test": {
              "field": "__selected__",
              "equal": "off"
            },
            "value": 0.1
          },
          "value": 1
        },
        "y": {
          "field": "__1____highlight",
          "type": "quantitative",
          "axis": null
        }
      }
    },
    {
      "mark": {
        "type": "text",
        "yOffset": -10,
        "size": 10,
        "opacity": 0.2
      },
      "encoding": {
        "text": {"field": "__1__"}
      }
    },
    {
      "mark": {
        "type": "text",
        "yOffset": -10,
        "size": 10
      },
      "encoding": {
        "text": {"field": "__1__"},
        "opacity": {
          "condition": {
            "test": {
              "field": "__selected__",
              "equal": "off"
            },
            "value": 0.1
          },
          "value": 1
        },
        "y": {
          "field": "__1____highlight",
          "type": "quantitative",
          "axis": null
        }
      }
    }
  ],
  "encoding": {
    "x": {
      "field": "__0__",
      "type": "ordinal",
      "axis": {"labelPadding": 0},
      "title": null
    },
    "y": {
      "field": "__1__",
      "type": "quantitative",
      "axis": null
    }
  }
}Matrix with defined height. Values formatted to two decimal places. Will respond to click by highlighting clicked dimension with a colour and making unselected values less opaque. This Template features a fold, for which I used 6 metrics, you can of course use more or fewer.
 The code provided is to create this visual
To create this visual you must paste the first block into the ‘Specification’ of Deneb. The Second box is to be pasted in ‘Config’.
{
"data": {"name": "dataset"},
"height": {"step": 35},
"transform": [
{
"fold": [
"Metric1",
"Metric2",
"Metric3",
"Metric4",
"Metric5",
"Metric6"
],
"as": ["metrics", "Number"]
}
],
"layer": [
{
"mark": {"type": "rect"},
"encoding": {
"color": {
"condition": {
"test": {
"field": "__selected__",
"equal": "on"
},
"value": "#7c5071"
},
"value": "#e3e3e3"
},
"opacity": {
"condition": {
"test": {
"field": "__selected__",
"equal": "off"
},
"value": 0.4
},
"value": 1
}
}
},
{
"mark": {
"type": "text",
"color": "black"
},
"encoding": {
"text": {
"field": "Number",
"format": ".2f"
},
"color": {
"condition": {
"test": {
"field": "__selected__",
"equal": "on"
},
"value": "white"
},
"value": "black"
},
"opacity": {
"condition": {
"test": {
"field": "__selected__",
"equal": "off"
},
"value": 0.2
},
"value": 1
}
}
}
],
"encoding": {
"x": {
"field": "metrics",
"scale": {"padding": 0.05},
"title": null
},
"y": {
"field": "Dimension",
"sort": {
"field": "5",
"order": "descending"
},
"title": null
}
}
}
{
"autosize": {"contains": "padding"},
"view": {"stroke": "transparent"},
"font": "Segoe UI",
"arc": {},
"area": {
"line": true,
"opacity": 0.4
},
"bar": {},
"line": {
"strokeWidth": 2,
"strokeCap": "round",
"strokeJoin": "round"
},
"path": {},
"point": {"filled": true, "size": 75},
"rect": {},
"shape": {},
"symbol": {
"strokeWidth": 1.5,
"size": 50
},
"text": {
"font": "Segoe UI",
"fontSize": 12,
"fill": "#605E5C"
},
"axis": {
"ticks": false,
"grid": false,
"domain": false,
"labelAngle": 0,
"labelColor": "#605E5C",
"labelFontSize": 12,
"titleFont": "wf_standard-font, helvetica, arial, sans-serif",
"titleColor": "#252423",
"titleFontSize": 16,
"titleFontWeight": "normal"
},
"axisQuantitative": {
"tickCount": 3,
"grid": true,
"gridColor": "#C8C6C4",
"gridDash": [1, 5],
"labelFlush": false
},
"axisBand": {"tickExtra": true},
"axisX": {
"labelPadding": 5,
"orient": "top",
"title": null,
"titlePadding": -10
},
"axisY": {"labelPadding": 10},
"header": {
"titleFont": "wf_standard-font, helvetica, arial, sans-serif",
"titleFontSize": 16,
"titleColor": "#252423",
"labelFont": "Segoe UI",
"labelFontSize": 13.333333333333332,
"labelColor": "#605E5C"
},
"legend": {
"titleFont": "Segoe UI",
"titleFontWeight": "bold",
"titleColor": "#605E5C",
"labelFont": "Segoe UI",
"labelFontSize": 13.333333333333332,
"labelColor": "#605E5C",
"symbolType": "circle",
"symbolSize": 75
}
}
Click responsive Bar Chart with data labels and cross highlighting
 The code provided is to create this visual
{"height": {"step": 35},
"data": {"name": "dataset"},
"layer": [
{
"mark": {
"type": "bar",
"opacity": 0.6,
"color": "#e3e3e3",
"tooltip": true
},
"encoding": {
"x": {
"field": "__1__",
"type": "quantitative"
}
}
},
{
"mark": {
"type": "bar",
"tooltip": true
},
"encoding": {
"opacity": {
"condition": {
"test": {
"field": "__selected__",
"equal": "off"
},
"value": 0.1
},
"value": 1
},
"color": {
"condition": {
"test": {
"field": "__selected__",
"equal": "on"
},
"value": "#917182"
},
"value": "#917182"
},
"x": {
"field": "__1____highlight",
"type": "quantitative"
}
}
},
{
"mark": {
"type": "text",
"tooltip": true,
"xOffset": 20
},
"encoding": {
"text": {
"field": "__1____highlight"
},
"opacity": {
"condition": {
"test": {
"field": "__selected__",
"equal": "off"
},
"value": 0.3
},
"value": 1
},
"color": {
"condition": {
"test": {
"field": "__selected__",
"equal": "on"
},
"value": "#917182"
},
"value": "grey"
},
"x": {
"field": "__1____highlight",
"type": "quantitative"
}
}
}
],
"encoding": {
"y": {
"field": "__0__",
"title": null,
"sort": {
"field": "__1__",
"op": "sum",
"order": "descending"
}
}
}
}
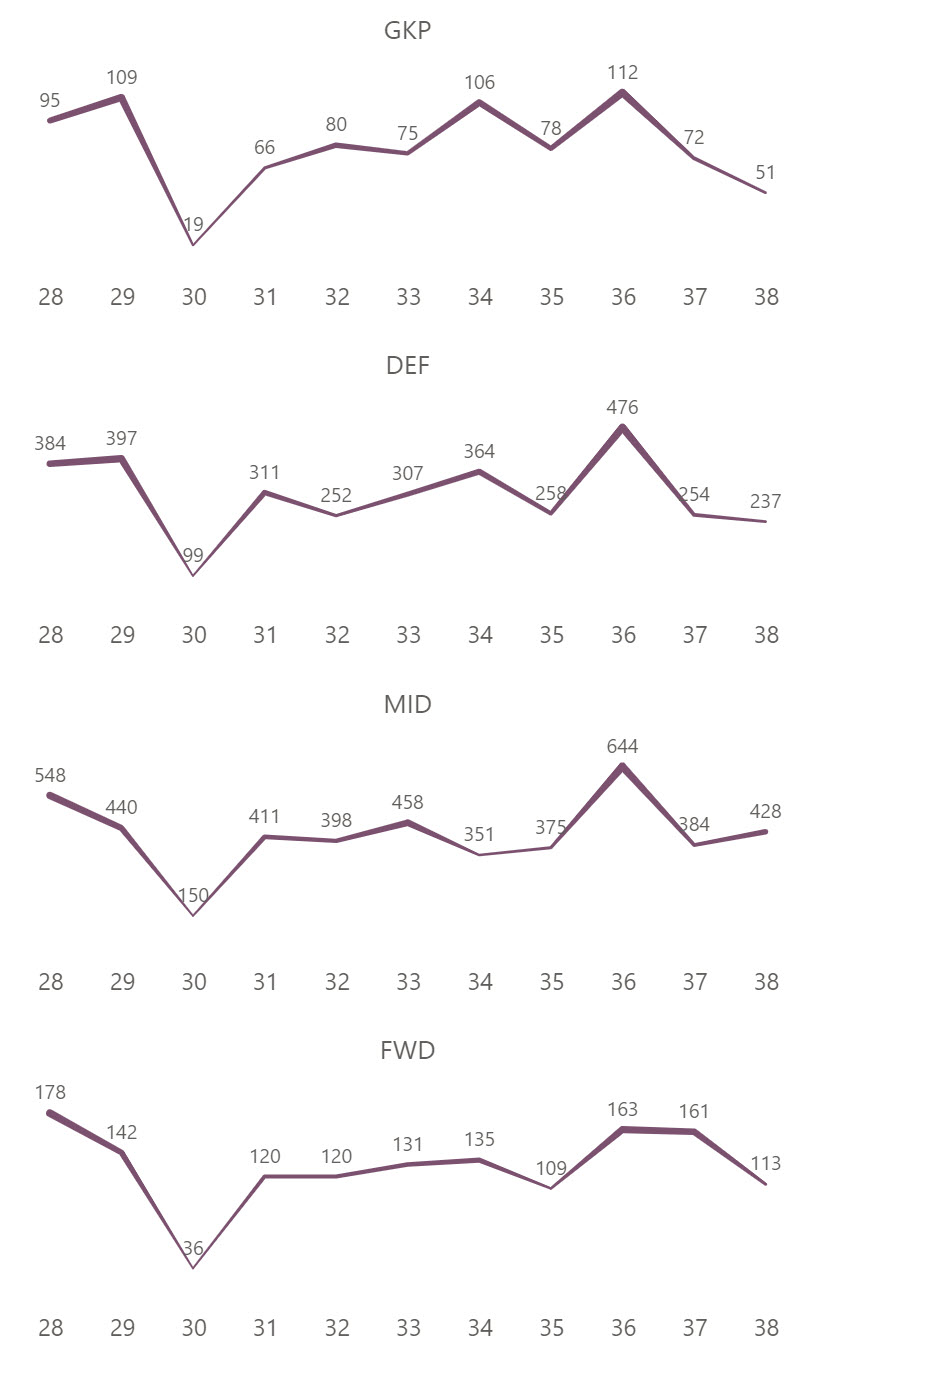
Trail visual in small multiples with data labels and Independent X and Y axis
{

  "data": {"name": "dataset"},
  "columns": 1,
  "facet": {
    "field": "__0__",
    "title": null,
    "type": "ordinal",
    "sort": {
      "op": "sum",
      "field": "__0__"
    }
  },
  "spec": {
    "encoding": {
      "x": {
        "field": "__1__",
        "type": "ordinal",
        "title": null
      },
      "y": {
        "field": "__2__",
        "type": "quantitative",
        "title": null,
        "axis": null
      }
    },
    "layer": [
      {
        "mark": {"type": "trail"},
        "height": 100,
        "width": 400,
        "encoding": {
          "color": {"value": "#7c5071"},
          "size": {
            "field": "__2__",
            "legend": null
          }
        }
      },
      {
        "mark": {
          "type": "text",
          "dy": -10,
          "size": 10
        },
        "encoding": {
          "text": {"field": "__2__"}
        }
      }
    ]
  },
  "resolve": {
    "scale": {
      "x": "independent",
      "y": "independent",
      "size": "independent"
    }
  }
}
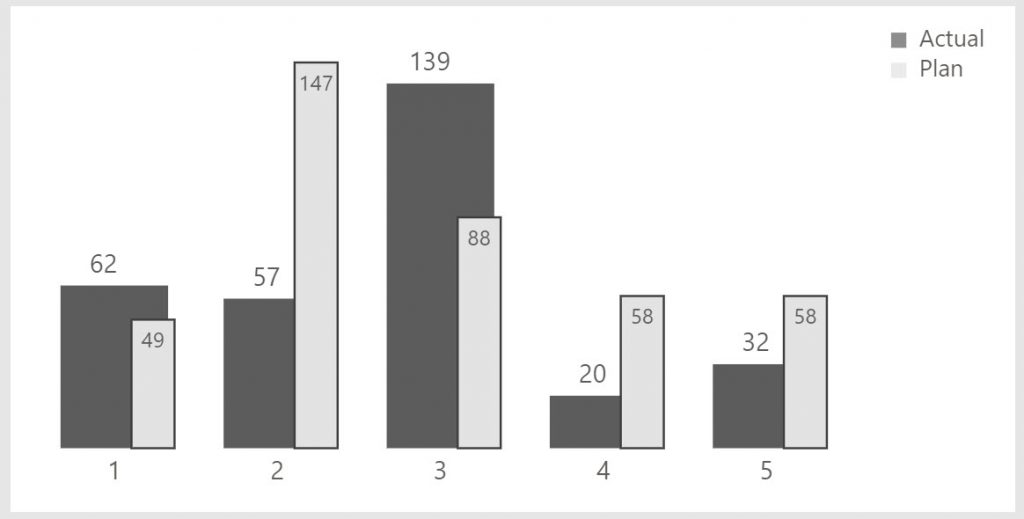
Bar chart for like for like comparison. All elements, including colours can be modified.
{

"data": {"name": "dataset"},
"layer": [
{
"transform": [
{
"fold": ["__1__", "__2__"],
"as": ["metrics", "Number"]
}
],
"mark": {
"type": "circle",
"size": 0
},
"encoding": {
"color": {
"field": "metrics",
"scale": {
"range": [
"#5c5c5c",
"#e3e3e3"
]
}
}
}
},
{
"mark": {
"type": "bar",
"color": "#5c5c5c",
"width": 80
}
},
{
"mark": {
"type": "bar",
"width": 30,
"color": "#e3e3e3",
"stroke": "black",
"xOffset": 30
},
"encoding": {
"y": {
"field": "__2__",
"type": "quantitative",
"axis": null
}
}
},
{
"mark": {
"type": "text",
"color": "black",
"yOffset": -10,
"xOffset": -5
},
"encoding": {
"text": {"field": "__1__"}
}
},
{
"mark": {
"type": "text",
"color": "black",
"yOffset": 10,
"xOffset": 30,
"size": 10
},
"encoding": {
"text": {"field": "__2__"},
"y": {
"field": "__2__",
"type": "quantitative",
"axis": null
}
}
}
],
"encoding": {
"x": {
"field": "__0__",
"title": null
},
"y": {
"field": "__1__",
"type": "quantitative",
"axis": null
}
}
}